Tablet users spent nearly 30% more time per session than desktop users watching online videos in the third quarter of 2011 and they were twice as likely as desktop viewers to complete those viewing sessions, according to Ooyala's Video Index Report.
In addition, during the quarter, Facebook was the most popular way to share video content, nearly nine times more popular than Twitter.
Below, additional findings from The 3Q11 Videomind Video Index Report, issued by Ooyala, a provider of video services to major brands.
Completed Video Sessions
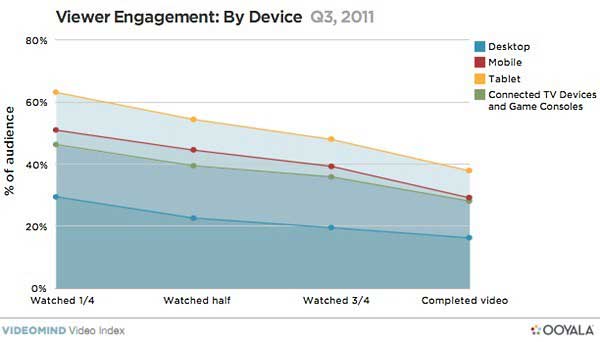
Device type heavily influences viewer engagement.
Tablet viewers were the most engaged with online video in 3Q11: Across all video content types, for every desktop viewer who completed a video, more than 2 viewers did so while watching via tablet device.

Across all video plays, the video completion rate for mobile devices was slightly higher than for connected TV devices and game consoles.
Length of Viewing Time
Tablet viewers also spent more time watching video on a per-session basis during 3Q11. On average, for each minute of video watched on a desktop, tablet users watched one minute and 17 seconds (1:17), roughly 28% longer than desktop viewers.
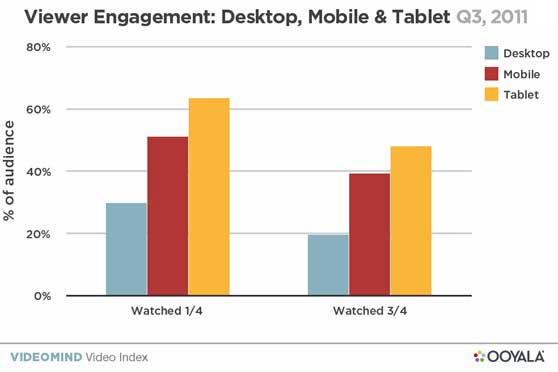
More specifically, across all video plays, mobile users were nearly twice as likely to watch three-quarters of an online video (39% vs. 20%), and tablet users were nearly 2.5 times more likely to do so, roughly 48% vs. 20%.

Longer Video
Though online viewers are more likely to turn to laptops or desktops to watch short clips, viewers are turning to tablets, mobile devices, and connected TV devices and game consoles for medium and long-form videos. In the third quarter, videos of 10 minutes or longer accounted for 30% of hours watched on mobile devices, 42% of hours on tablets, and 75% on connected TV devices and game consoles.
Moreover, viewer engagement was generally higher on mobile devices than on desktops, even for long-form videos: Mobile viewers completed three-quarters of a long-form video at a rate of 20%, compared with 18% for desktops.
Device Preferences
Apple's iPad was the most popular tablet for viewing online video during the third quarter, accounting for 99.4% of displays and 97.7% of total plays.
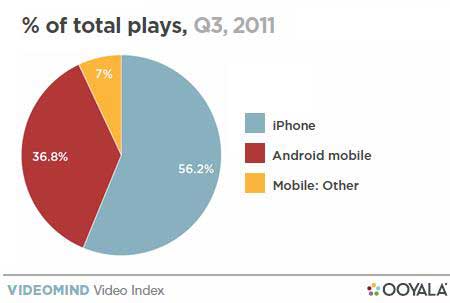
iPhones accounted for 56% of video plays, compared with 36.8% for Android-powered smartphones:

However, Android edged out iPhone in total video minutes, 49% vs. 44%.
Looking for real, hard data that can help you match social media tools and tactics to your marketing goals? The State of Social Media Marketing, a 240-page original research report from MarketingProfs, gives you the inside scoop on how 5,140 marketing pros are using social media to create winning campaigns, measure ROI, and reach audiences in new and exciting ways.
Video Sharing
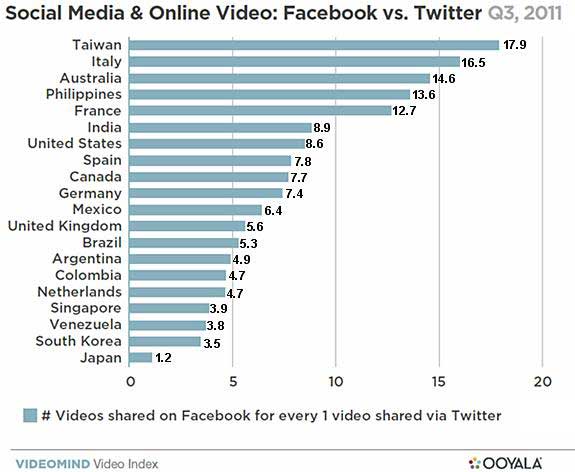
On average, Facebook is a more popular means of sharing video than Twitter—but that margin varies widely depending on region. In the US, for example, there is an 8.6:1 ratio between Facebook and Twitter sharing, whereas in Japan the sharing ratio is nearly equal (1.2:1).

By contrast, in Italy, sharing on Facebook is 17 times more popular than on Twitter.
About the report: The data sample used in this report covers the third quarter of 2011, from July 1 to September 30. The data were compiled via an anonymous cross-section of Ooyala's customer and partner database—an array of broadcasters, studios, cable operators, print publications, online media, and consumer brand companies in over 30 different countries. Collectively, more than 100 million unique viewers watch an Ooyala-powered video every month in 100 countries across more than 5,000 unique domains.


