More than ever, B2B marketers are held accountable to driving revenue—and proving that they are. We're investing in the right technologies and programs, and fueling channels and tools with high-quality, buyer-centric content.
But what's actually working and what's falling flat? Fully 50% of B2B enterprise marketers cite the inability to measure content effectiveness as a challenge.
If you're part of that 50% struggling to prove impact, start tracking the three key areas below—and start today.
The following three sets of metrics are what our marketing team at Kapost uses to create more powerful content that fills our pipeline. They will give you insight into the worth of your content and help you make more strategic marketing decisions to drive results and revenue.
1. The Health of Your Content Production Cycle
If you spend a significant chunk of time sifting through emails and attachments to get a single asset out the door... join the club!
Unfortunately, inefficiencies cut deeply into your time, productivity, and ultimately your budget. Inefficiencies in the content production process are costing midsize to large companies a whopping $958 million a year.
By tracking and optimizing your content production process, you'll get more content out the door faster and cheaper, because you will have created a systematic workflow that eliminates time spent wrangling confusing spreadsheets that cut into time (and therefore cost more money). And, ultimately, you'll pump more revenue into your company's pipeline.
Here are the key metrics to track.
A. Average Length of Production
Track the start and finish dates for various content types to start establishing a baseline for overall content timelines. You'll eventually be able to benchmark how long key assets will take to create and deliver. Having those benchmarks will help your team plan ahead and give you insight into the resources you need to deliver the content that supports your revenue goals.
B. Delivery Rates
Track which pieces of content are delivered on time, and which pieces are regularly overdue. By doing so, you'll begin to track the bottlenecks in your workflows. Bottlenecks cut into time, and your time is money to your company.
To address bottlenecks, track your established workflows to see whether a specific team member or group is frequently holding up the process. For example, the process of creating a case study requires at least 10 of us at Kapost: writers, editors, designers, account managers, a website manager, among others. Each person has tasks and deadlines in a single asset's workflow.
If people in the workflow are continually missing deadlines, you can approach them with data instead of finger-pointing and blame games, and find real solutions to challenges that impede productivity, and ultimately cost money.
C. Content Coverage Gaps
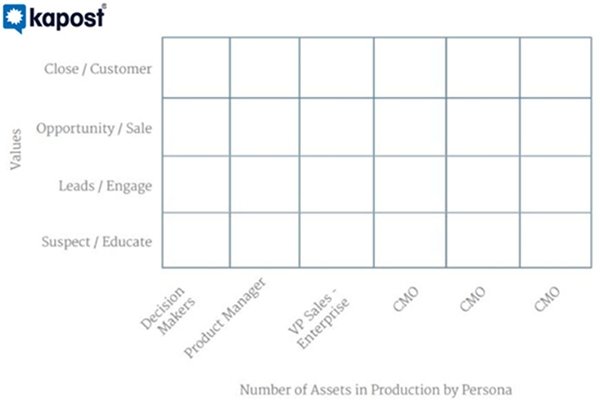
By mapping content to the customer experience, based on persona and buying stage, you ensure a seamless journey from first engagement to closed deal to customer advocacy. It's important that your company produce relevant content for every step on that journey. It sounds basic, but it's something many B2B companies do not focus on.
To identify gaps in content coverage for each target persona at every step in the buyer's journey, at Kapost we use a heat map. If you don't track this metric, you risk relying on guesswork to fill important gaps. Use this template to get started:
2. Your Content's Reach
A. External Reach
According to a Demand Metric study, 17% of marketers said they have no content effectiveness measurements in place, and 49% said they are using only basic metrics such as clicks or downloads.
Clicks and downloads tell us about engagement, but they don't give us insight that ties back to revenue.
To know the true value of your content, you need more meaningful analytics than engagement alone. You need data that shows you what channels and content types more effectively drive leads deeper into the buyer's journey.
So to stop wasting time developing irrelevant content for content's sake, use the following key metrics to track beyond clicks so you can measure the true ROI your content.
a. Cross-Channel Reach
- Engagements per month by type of engagement (views, downloads, opens, etc.)
- Traffic by channel category (direct, paid, organic, etc.) for each piece of content
- Referral percentage by channel source
b. Engagement by Category (Clicks, Downloads, Shares)
- Engagements by content type
- Engagements by sales stages
- Engagements by buyer persona
c. Top Engaged-With Content
- 10 most engaged-with content per quarter
- 10 most shared content per quarter
Ultimately, you want your content to drive visitors faster and further into the sales funnel. All of this data culminates in insights into what content and channels are working. It's your job to take the data and make more of what is working, and less of what is not.
B. Internal Reach
Have you ever poured loads of time, energy, and creative bandwidth into a shining, glorious piece of content, only to hear a month later that the sales team never used it?
If not, let me tell you from firsthand experience. It's a real bummer.
Internal reach metrics are often overlooked in the B2B content marketing space, but it's critical to know whether your internal teams use your content—and how.
Here are some internal metrics you can begin tracking right away to start measuring the value of your content to your colleagues.
- Internal consumption: Month over month (MoM) internal views of assets; and MoM internal downloads of assets
- Internal shares: MoM internal shares of assets via email or social
- Referrals earned: MoM referral traffic from internal shares
By tracking these internal metrics, you get a clear picture of the content that is being used by your internal teams—and the content not being used. The result? You can spend less time and money creating lovely yet irrelevant content, and more time creating valuable content that gets used by Sales... and so ultimately generates revenue.
3. Your Content's ROI (via Your Content Scoring Strategy)
Content scoring is another one of those buzzwords in marketing these days.
Some 77% of buyers want different content at each stage of the product research process. Content scoring measures your content's effectiveness in driving conversions at each stage of your buyer's journey, and assigns it a value.
It's a big deal. I could write 10 posts on content scoring, but this video provides a great overview.
But how do you integrate content scoring into your workflow in a way that will deliver value to your team and prove your content ROI?
Here are a few things to consider when setting up your content scoring strategy.
A. Clearly Define and Get Cross-Team Alignment on the Buyer's Journey
If you don't have a clearly defined buyer's journey across your sales, marketing, and customer success teams, you run the risk of experiencing miscommunication, misalignment on messaging, and general chaos.
B. Then, Map Out Content Types Associated With Each Stage
For reference, here is an example chart from a recent e-book of ours. It maps out the buyer's journey at the top, and for each stage defines the marketing teams involved in content development, the types of content to be created within each stage, the conversion goals for each stage, and the key metrics to track.
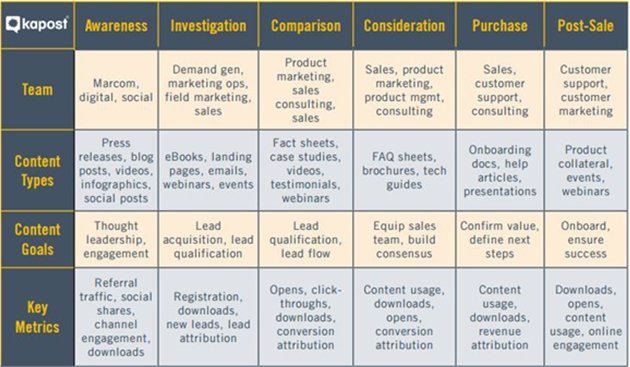
A chart like this keeps the bigger picture clear and accessible across marketing functions.
C. Assign Scores to Key Content Types
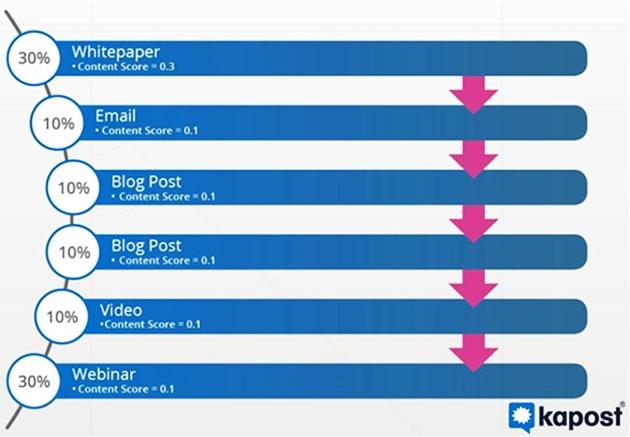
We use the first touch/last touch model at Kapost: For each stage of the defined buyer's journey, whatever content was touched first and last within a stage gets a higher content score (let's say, 0.33), and the remaining assets that were touched in between are evenly distributed until the value is 1.0 for a single lead (more on that here).
Here is a chart explaining the first touch/last touch concept.
Now imagine that hundreds of people are interacting with your content and moving from stage to stage. You'll begin to see trends: Which content types and themes are most effectively moving people down the pipeline.
* * *
This is just the tip of the iceberg in measuring the true value of your content, but these tips should help you get well on your way to content marketing success.