What proportion of emails sent by marketers ends up in consumers' spam folders, what proportion is flagged as spam, and what proportion is flagged as not spam?
To find out, Return Path examined more than 6.9 billion commercial emails sent by more than 17,000 brands in 2018.
The researchers looked at the average spam placement rate (percentage of emails that end up in spam folders), complaint rate (percentage of emails reported as spam/junk), and "this is not spam" rate (percentage of emails reported as not being spam/junk) for brands in 27 verticals.
Below, key findings from the analysis.
Spam Placement Rate
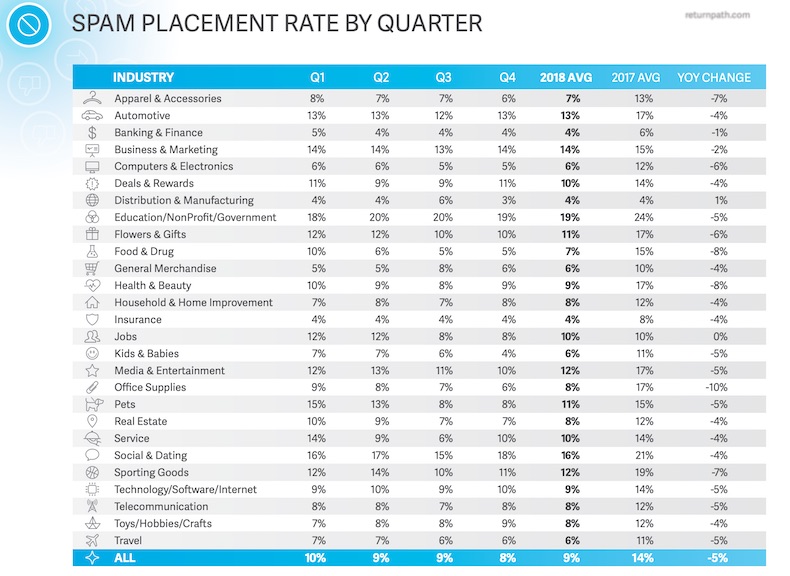
The average spam placement rate in 2018 across all industries examined was 9%.
The education/nonprofit/government vertical had the highest average spam placement rate (19%), and the distribution/manufacturing and banking/finance verticals had the lowest (4%).
Complaint Rate
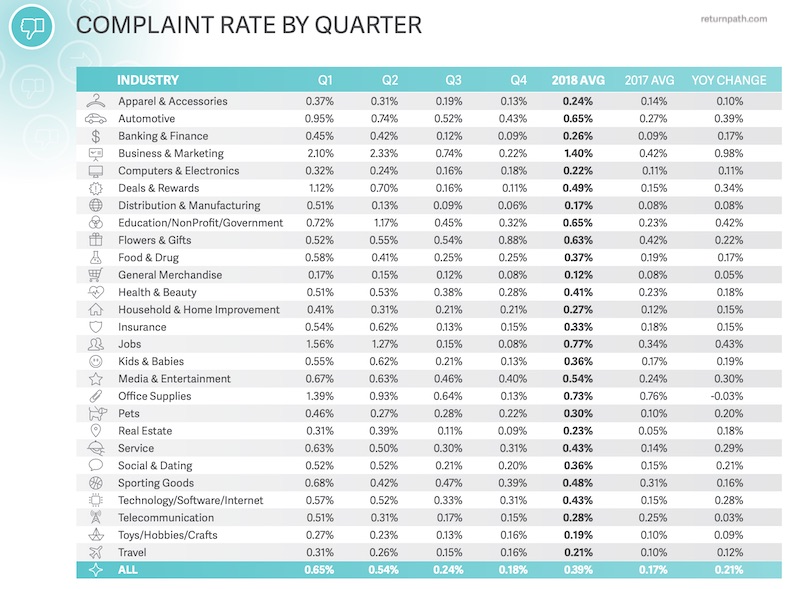
The average complaint rate in 2018 across all industries examined was 0.39%.
The business/marketing vertical had the highest average complaint rate rate (1.4%), and the general merchandise vertical had the lowest (0.12%).
This Is Not Spam Rate
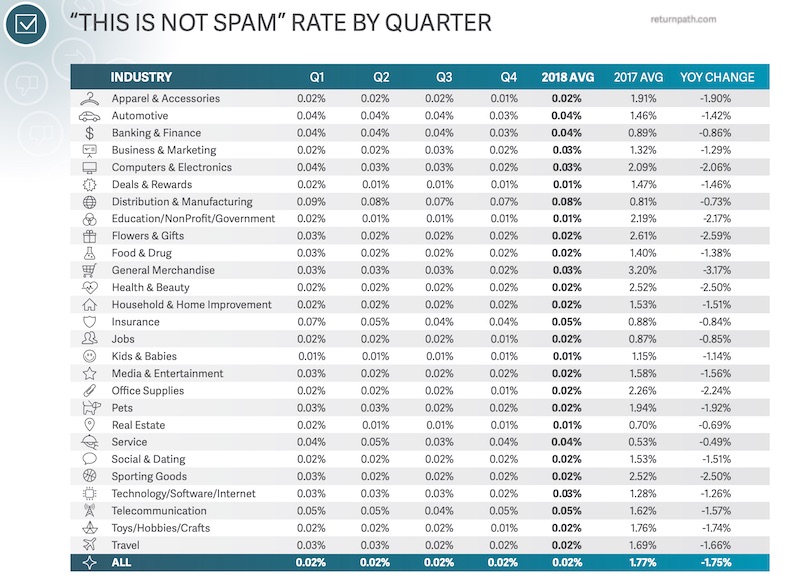
The average "this is not spam" rate across all industries examined was 0.02%.
The distribution/manufacturing vertical had the highest average "this is not spam" rate (0.08%), and the education/nonprofit/government and real estate verticals had the lowest (0.01%).
About the research: The report was based on data from an analysis of 6.9 billion commercial emails sent by more than 17,000 brands in 2018.


