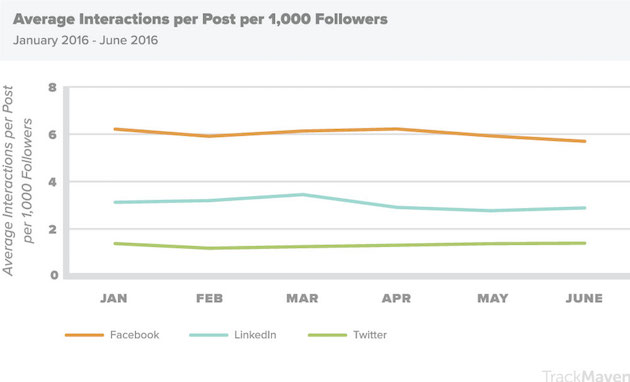
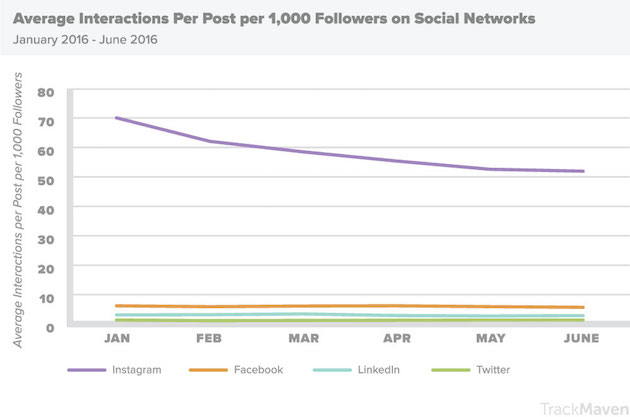
Social media engagement with brands generally decreased on Facebook, LinkedIn, and Instagram in the first half of 2016, but interactions registered a slight uptick on Twitter, according to recent research from TrackMaven.
The report was based on an analysis of the social media content of more than 40,000 companies posted in the first six months of 2016. The dataset included 51 million pieces of content posted to four major social networks: Facebook, Twitter, Instagram, and LinkedIn.
The average engagement ratio (interactions per post per brand per 1,000 followers) on Instagram dropped 26% between January and June, 2016, the analysis found.
The average engagement ratio dropped 8% on Facebook and LinkedIn in the first half of 2016, and increased 1% on Twitter.

Despite the dip in interactions in 1H16, Instagram still has the highest average engagement ratio for brands by far, outpacing the other social networks examined by more than tenfold.

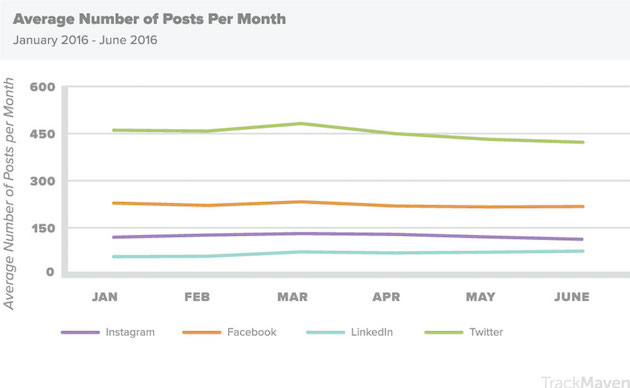
The average monthly posting frequency for businesses was fairly steady in the first half of 2016 on Facebook and Instagram.
The average number of tweets sent by brands on Twitter fell from 482 per month in March to 422 per month in June.
The monthly posting frequency by brands on LinkedIn rose from 58 pieces per month in January to 76 pieces per month in June.

About the research: The report was based on an analysis of the social media content of more than 40,000 companies posted in the first six months of 2016. The dataset included 51 million pieces of content posted to four major social networks: Facebook, Twitter, Instagram, and LinkedIn.


