The most popular days and times that brands post content to various marketing channels aren't necessarily the most effective, according to a series of reports from TrackMaven.
The data came from a research series released last year by TrackMaven, including a Twitter report (based on 1.7 million tweets from 1,423 brand accounts), blog report (1.2 million posts from 4,618 brands), email report (93,000 emails from 2,000 email lists), Instagram report (accounts of Fortune 500 companies), and Facebook report (1.5 million from nearly 6,000 brand pages).
Key findings from the research include the following:
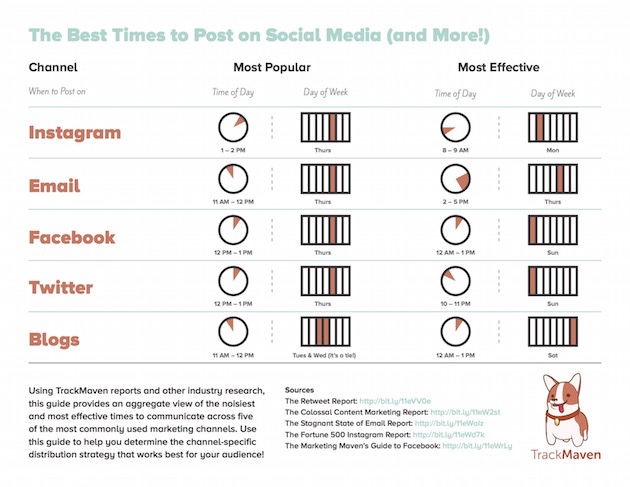
Instagram: The most popular day that brands post content to Instagram is Thursday, and the most popular time is between 1 PM and 2PM; the most effective day (i.e., with the highest engagement level) is Monday and the most effective time is between 8 AM and 9 AM (all times are US EST; days/times are b,ased on cumulative data with popularity/effectiveness varying from brand to brand).
Email: The most popular day for sending emails is Thursday, and the most popular time is between 11 AM and 12 PM; the most effective day is Thursday, and the most effective time is between 2 PM and 5 PM.
Facebook: The most popular day for posting to Facebook is Thursday, and the most popular time is between 12 PM and 1 PM; the most effective day is Sunday, and the most effective time is between 12 AM and 1 PM.
Twitter: The most popular day for tweeting is Thursday, and the most popular time is between 12 PM and 1 PM; the most effective day is Sunday, and the most effective time is between 10 PM and 11 PM.
Blogs: The most popular days for posting to blogs are Tuesday and Wednesday, and the most popular time is between 11 AM and 12 PM; the most effective day is Saturday, and the most effective time is between 12 AM and 1 PM.
All times are EST.
About the research: The data came from a research series released last year by TrackMaven, including a Twitter report (based on 1.7 million tweets from 1,423 brand accounts), blog report (1.2 million posts from 4,618 brands), email report (93,000 emails from 2,000 email lists), Instagram report (accounts of Fortune 500 companies), and Facebook report (1.5 million from nearly 6,000 brand pages).


