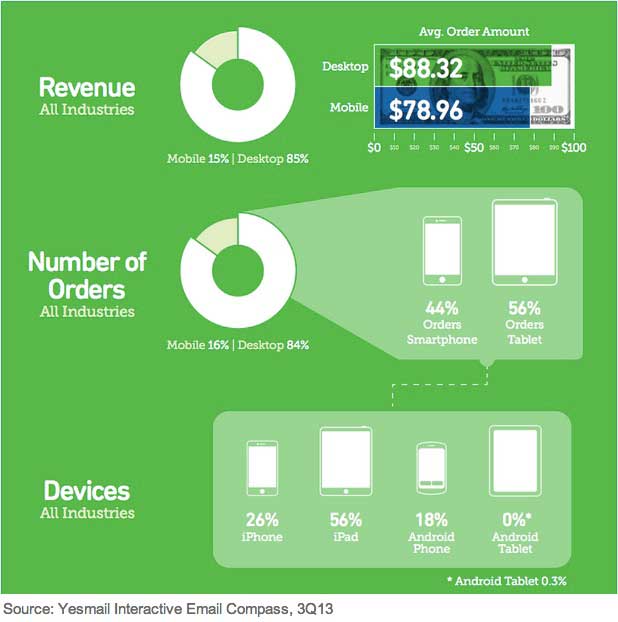
Across all industries, 16% of sales driven by email now happen via a mobile device, with 56% of those mobile sales being completed on a tablet and 44% on a smartphone, according to a recent report by Yesmail.
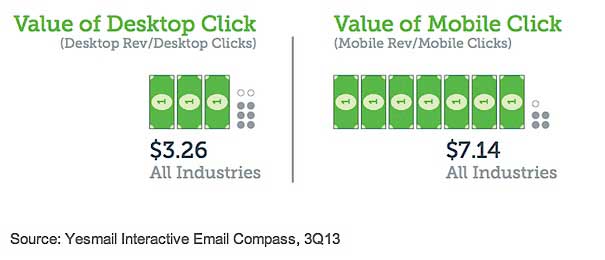
The email conversion rate (number of orders divided by unique clicks) remains higher for desktop than for mobile (3.7% versus 1.3%). However, revenue per mobile click is almost double that of a desktop click, suggesting that even though emails are clicked through less often on mobile devices, those mobile clicks lead to purchases more frequently than desktop clicks do.

Below, additional key findings from the report, which was based on data from 5.4 billion emails sent in 3Q13.
Mobile Trends
- The average order value was approximately $9 less on mobile than on desktop in 3Q13. However, that gap was considerably smaller for retail: a little over $2.
- The number of subscribers who view emails exclusively on their mobile device has grown by almost 50% from 2Q13.
- Android continues to close the gap on iOS; in 3Q13, 41% of smartphone purchases driven by email came from an Android device, whereas 59% came from an iPhone.
- Over 99% of all tablet purchases driven by email are completed on an iPad.

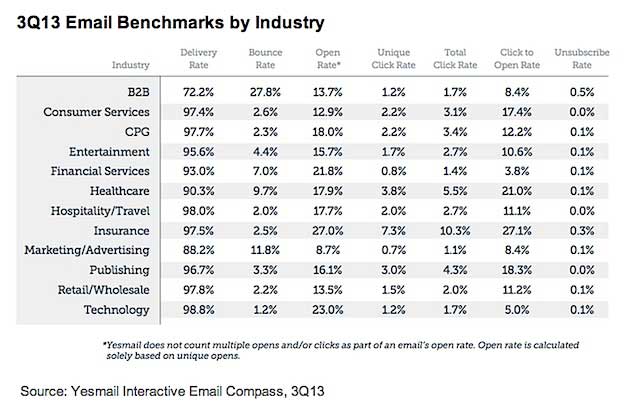
Email Benchmarks by Industry
In general, marketers in 3Q13 recorded lower email click rates but consistent open rates:
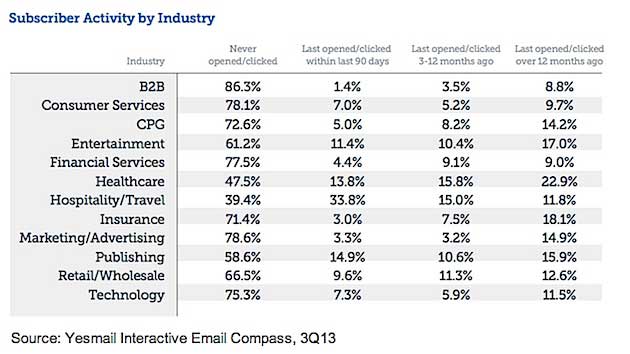
Subscriber Activity Metrics
- Marketers who sent 3-7 emails per week had the highest active subscriber rates (emails opened and clicked in the last 90 days) in 3Q13.
- Consumers who had subscribed most recently (within 90 days) had the highest active subscriber rate at almost 20%.
- On average, across all industries, the active email subscriber rate increased 5% from 2Q13 to 3Q13.
- The hospitality/travel industry had the highest percentage of active subscribers and the lowest rate of inactive ones in 3Q13.
About the research: The report was based on data from 5.4 billion emails sent in 3Q13.


