About 95% of Americans watch TV using traditional cable or satellite options, whereas the other 5%—the so-called "Zero-TV" viewers—are bucking tradition (because of cost or lack of interest) in favor of nontraditional devices and services, according to a report by Nielsen.
Moreover, the number of Zero-TV households in the US grew to more than 5 million in 2013, up from just over 2 million in 2007.
Below, additional findings from Nielsen's Fourth-Quarter 2012 Cross-Platform Report.
Though most (75%) Zero-TV households still own at least one TV, they tend to use those sets to watch DVDs, play games, or browse the Internet.
New Viewing Devices
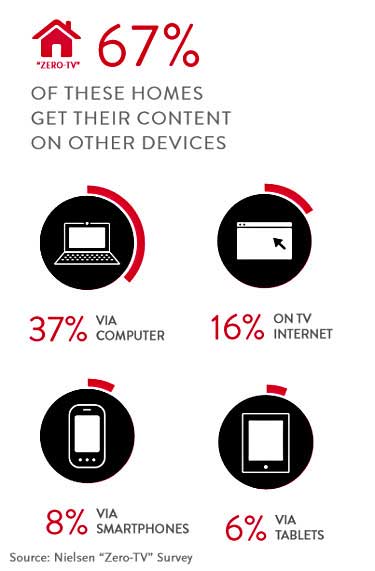
When viewing video content, more than two-thirds (67%) of Zero-TV households use non-traditional devices, such as computers (37%), the Internet via TV (16%), smartphones (8%), and tablets (6%):

Cost (36%) and lack of interest (31%) are the main reasons Americans are opting out of pay-television services.
Meanwhile, nearly one-half (48%) of Zero-TV homes watch TV content via subscription services (e.g., Netflix, Hulu Plus), although 18% report they'd consider subscribing to pay-television services in the future.
Demographics
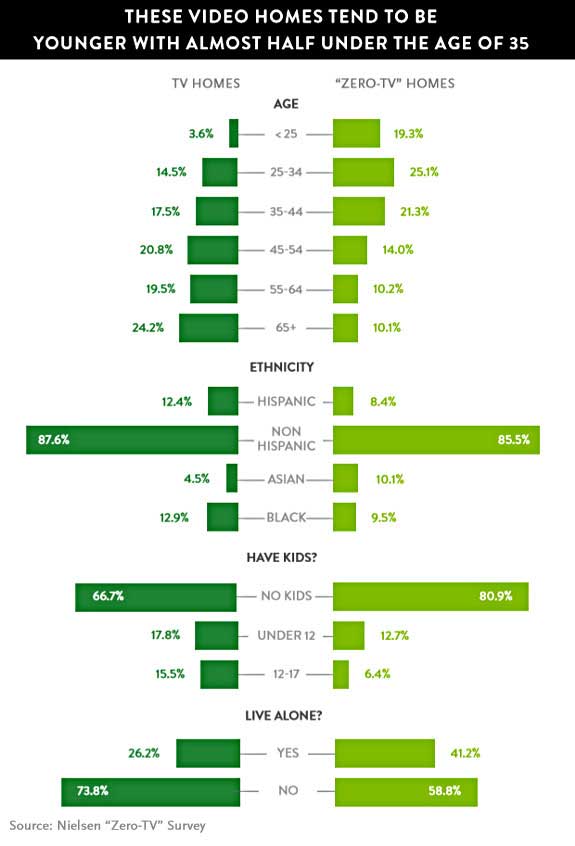
Zero-TV viewers tend to be young: 44.4 % are under age 35. Meanwhile, such viewers tend to be non-Hispanic (85.5%) and living without children (80.9%).

American Video Content Viewing
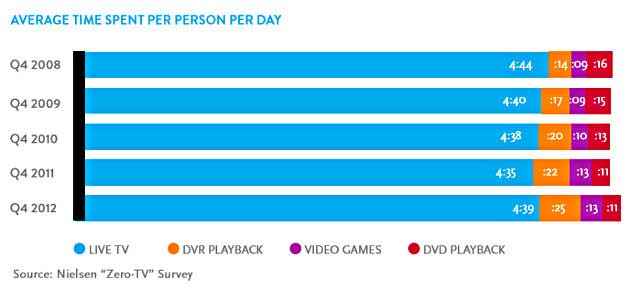
On average, Americans spend more than 41 hours each week—nearly five-and-one-half hours (5:28) daily—engaging with content across all screens. They spend most of that time each day—roughly four-and-one-half hours (4:39) in front of a TV, and they spend 25 minutes of those TV hours watching time-shifted content.

Viewing behavior varies by ethnicity, however: African-Americans spend close to 55 hours engaging on all screens, Hispanics just over 35 hours, and Asian-Americans roughly 27 hours.
About the data: Findings from Nielsen's Fourth-Quarter 2012 Cross-Platform Report are based on online, mobile, and television data collected in the fourth quarter of 2013. Traditional TV includes live usage plus any playback viewing within the measurement period. Time-shifted TV is playback primarily on a DVR but includes playback from VOD, DVD recorders, server based DVR’s and services like Start Over. Television data was collected from Oct. 1 2012 to Dec. 31, 2012. Hours and minutes of Internet and video use are based on the universe of persons who used the Internet/watched online video. Nielsen's mobile survey reports mobile video usage for those users age 13+.


