Some 400 million Tweets are posted on Twitter every day, and that vast flow of information is beginning to offer public health researchers new and timely insights into the patterns of disease and influenza, according to new research led by Mark Dredze of The Human Language Technology Center of Excellence (HLTCOE) and Department of Computer Science at The Johns Hopkins University.
Moreover, the researchers' real-time method of flu tracking, based on the analysis of 5,000 publicly available tweets per minute, appears to track closely with government disease data that takes much longer to compile, according to Johns Hopkins.
Since May 2009, Johns Hopkins researchers have been monitoring Twitter messages related to about 15 diseases. But they've been closely following flu-related tweets since early 2011.
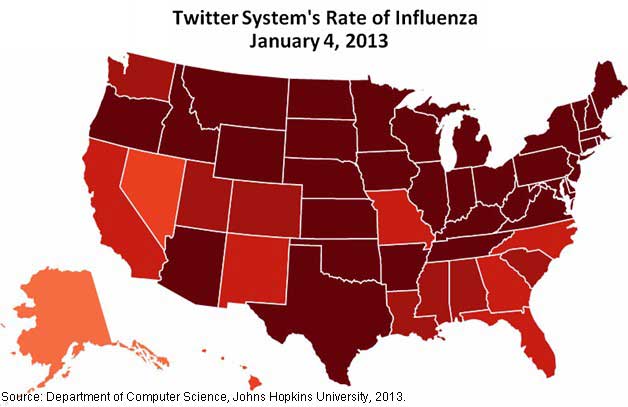
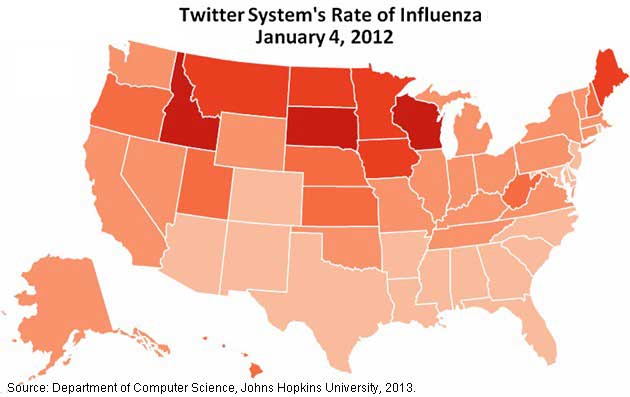
Using those tweets, the researchers developed two infographics of the United States that illustrate the stark differences between the 2011-2012 mild flu season and the much higher incidence of the virus in the winter of 2012-2013.
The map below shows the Twitter system's rate of influenza in each state in the first week of January 2013 (higher flu rates are marked with darker red), during which the country was awash in a high flu rate:
By contrast, during the 2011-2012 flu season, the US was relatively unscathed during the same week:
Even so, the research hasn't been without its challenges.
Flu-Infection Tweets vs. Flu Chatter
A critical part of the analytical process has been to find a way to differentiate tweets about the flu (e.g., chatter) from those by people who actually have the flu.
For example, finding a tweet that reads "I have the flu" is an ideal data point. With that message, researchers could simply record the date of the tweet and the location of the user, via geo-location analysis.
However, many flu-related tweets are sent by people who are only talking about the illness, worried about it, asking flu-related questions, or sharing flu-related content with others.
A Better Technique for Feed Analysis
To address the problem, Johns Hopkins researchers developed a statistical algorithm which examines various aspects of language, including the grammar of tweets, and assigns variables to tweets containing certain features, for example:
- A URL link in the message, indicating that someone is sharing content rather than suffering from the illness.
- A question mark, signaling that the user needs information (rather than necessarily being sick).
- The grammatical composition of the tweet (i.e., which nouns, verbs, and pronouns are being used, and in what sequence).
"When you look at Twitter posts, you can see people talking about being afraid of catching the flu or asking friends if they should get a flu shot or mentioning a public figure who seems to be ill," said Mark Dredze, assistant research professor in the Department of Computer Science.
"But posts like this don't measure how many people have actually contracted the flu. We wanted to separate hype about the flu from messages from people who truly become ill."