Consumers continue to spend more time on social networks than on any other category of website—roughly 20% of their total time online via personal computer (PC) and 30% of their total time online via mobile—according to a report by NM Incite and Nielsen.
Moreover, the total amount of time spent using social media in the US across PCs and mobile devices increased 37% in 2012 year over year (YOY), to 121 billion minutes as of July, from 88 billion in July 2011.
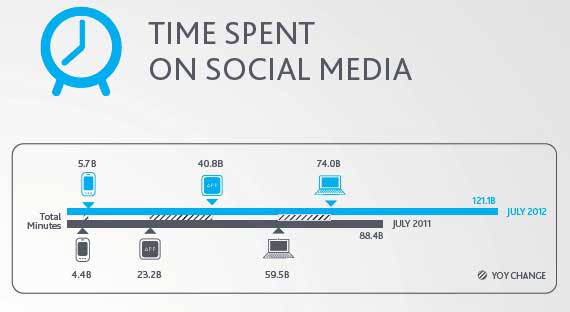
Though social media audiences via PC declined a slight 5% YOY (from 163.6 million in 2011 to 171.8 million in 2012), the amount of time spent using social channels via PC increased 24% YOY over the same period (from 59.5 billion minutes in 2011, to 74.0 billion in 2012), signaling a deeper level of user engagement.
However, mobile is clearly a key driver of social media use.
Consumers increased their time spent using social mobile apps 76% YOY, from 23.2 billion minutes in 2011 to 40.8 billion in 2012.
Though the mobile Web accounted for a smaller proportion of time spent with social media in 2012 (roughly seven times less than with apps), mobile Web use grew 29% YOY, from 4.4 billion minutes in 2011 to 5.7 billion in 2012.
Below, additional findings from Nielsen's Social Media Report for 2012.
Mobile Social Audiences Growing
The number of social media users who accessed social sites via mobile channels nearly doubled in 2012:
- Mobile Web audiences rose from 43.0 million in 2011 to 81.8 million in 2012.
- Mobile apps users grew from 44.8 million in 2011 to 85.8 million in 2012.
Even so, PC access still accounted for most (61%) of the time spent with social sites in 2012; apps accounted for 34%, and mobile devices accounted for 5% of the total.
Top Social Sites
Though Facebook is still the most popular social network, new social media sites continue to emerge and gain momentum.
Facebook is now the most-visited social network in the US with 152.2 million visitors via PC, 78.4 million users via mobile apps, and 74.3 million visitors via the mobile Web. The site is also the top US Web brand in terms of time spent online: 17% of time spent online via PC is with Facebook.
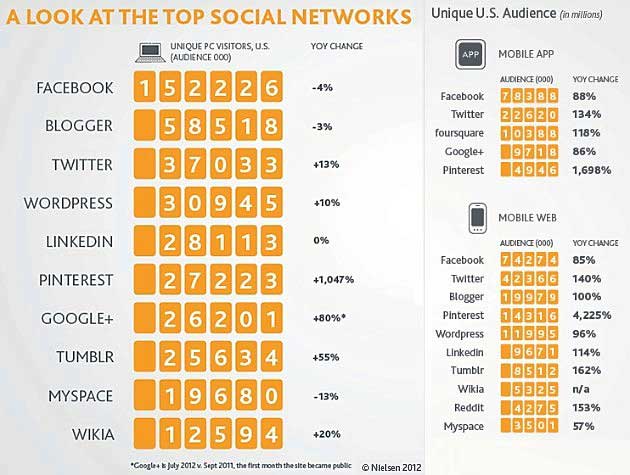
Despite the continued popularity of Facebook and Twitter, Pinterest emerged as a one of the breakout stars in social media for 2012, boasting the largest YOY increase in US penetration via PC (up 1,047%), mobile app (1,609%), and mobile Web (4,225%).
About the data: The Nielsen US Social Media Survey 2012 is based on a representative sample of 1,998 adult (18+) social media users recruited via the Nielsen Online Panel; the survey was fielded from July 19 to August 8, 2012. " Social media user" is defined as participating, talking, and networking online via various platforms to share information and resources. Those platforms include Internet forums, blogs, Facebook, Twitter, and video-sharing, consumer rating, and other social networking websites.