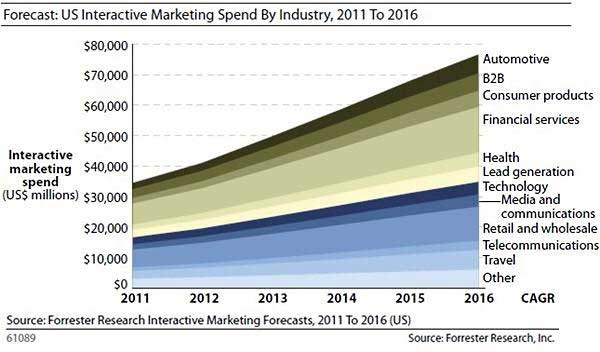
Interactive marketing budgets are forecast to grow at a compound annual growth rate (CAGR) of 17% over the next five years, but not all industries will invest at the same pace, according to a new report by Forrester Research.
Overall, marketers across all industries are expected to spend nearly $77 billion, or 26% of all ad dollars, on interactive marketing by 2016.
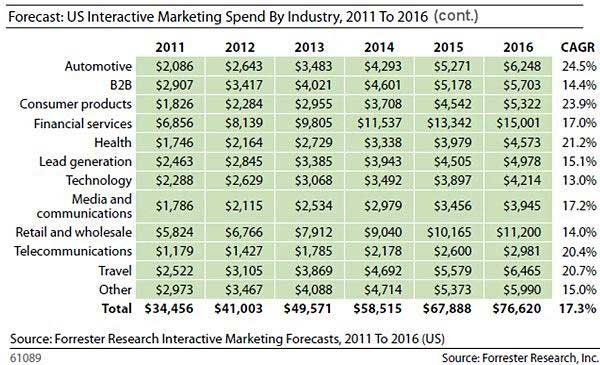
Companies in the financial services sector are expected to spend the most on interactive marketing, whereas automotive and consumer goods businesses will record the steepest growth over the five-year forecast period. B2B interactive marketing budgets are expected to remain relatively small and grow at lower rates through 2016.

Below, additional projections from the US Interactive Marketing Forecast by Industry, 2011 to 2016, issued by Forrester Research:
- B2B interactive marketing (search marketing, display advertising, mobile marketing, email marketing, and social media) spending is expected to grow at a 14.4% CAGR, to 5.7 billion in 2016. Despite the relatively low growth, B2B is projected to boost mobile marketing investments, from $129 million in 2011, to $639 million in 2016—a 38% CAGR over the next five years.
- Financial Services is forecast to spend the most on interactive marketing, growing at a 17.0% CAGR over the next five years, to $15.0 billion by 2016.
-
Technology interactive marketing is expected to grow at a 13.0% CAGR over the next five years, to $4.2 billion in 2016.
- Big offline spenders—the automotive, healthcare, and consumer goods industries—are projected to grow their interactive spend the most. For example, automotive interactive marketing is expected to grow at a 24.5% CAGR over the next five years, to $6.2 billion in 2016.
- Consumer goods interactive spending is forecast to hit $5.3 billion in five years, pacing at a 23.9% CAGR.

Looking for great digital marketing data? MarketingProfs reviewed hundreds of research sources to create our most recent Digital Marketing Factbook (May 2010), a 296-page compilation of data and 254 charts, covering email marketing, social media, search engine marketing, e-commerce, and mobile marketing. Also check out The State of Social Media Marketing, a 240-page original research report from MarketingProfs.
About the data: All projections are from the Forrester Research Interactive Marketing Forecast, 2011 to 2016, issued on November 15, 2011.


