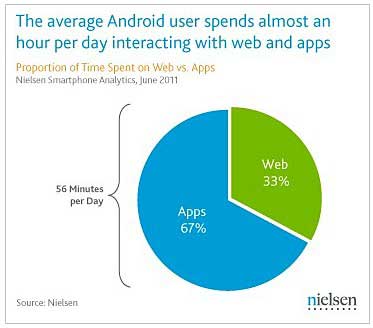
Android owners in the US spent an average of 56 minutes per day interacting with the Web and apps via their phones in June 2011 and of that time, two-thirds (67%) was spent using mobile apps while one-third (33%) was spent browsing the mobile Web, according to a report from Nielsen Smartphone Analytics.
Interestingly, despite the hundreds of thousands of apps available for the Google Android OS, a very small proportion of apps make up most of the time spent on such devices.
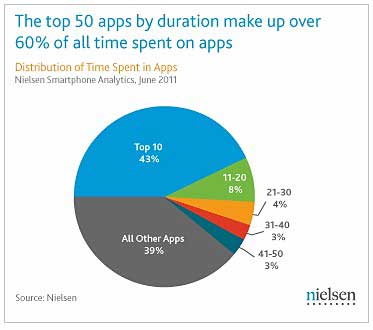
For example, the top 10 Android apps accounted for 43% of the total time spent by Android consumers on mobile apps in June.

The top 50 apps accounted for 61% of all time spent using apps. That finding implies that with 250,000+ Android apps available on the market (as of June), the remaining 249,950+ apps are competing for the remaining 39% of the mobile apps pie.
About the data: Findings are from the newly launched Nielsen Smartphone Analytics report, which tracks and analyzes data from on-device meters installed on thousands of iOS and Android smartphones.


