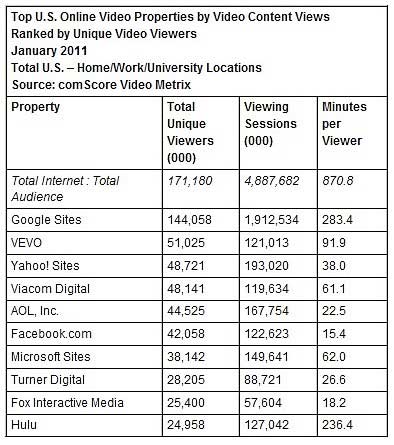
Some 171 million US Internet users watched online video in January 2011, engaging in nearly 4.9 billion viewer sessions during the month, according to comScore Video Metrix. Google Sites, driven primarily by viewing at YouTube, was the top video content property, attracting 144.1 million unique viewers, followed by Vevo with 51.0 million.
Yahoo Sites was third with 48.7 million viewers, followed by Viacom Digital with 48.1 million and AOL with 44.5 million.

Google Sites had the highest number of viewer sessions during the month (1.9 billion), while second-ranked Vevo had 121.0 million sessions, roughly 6.3% of Google's volume.
Some 83.5% of the US Internet audience viewed online videos in January for an average of 14.5 hours per viewer.
The duration of the average online content video was 5.0 minutes, while the average online video ad was 0.4 minutes.
Looking for great digital marketing data? MarketingProfs reviewed hundreds of research sources to create our most recent Digital Marketing Factbook (May 2010), a 296-page compilation of data and 254 charts, covering email marketing, social media, search engine marketing, e-commerce, and mobile marketing. Also check out The State of Social Media Marketing, a 240-page original research report from MarketingProfs.
Top 10 Video Ad Properties by Ads Viewed
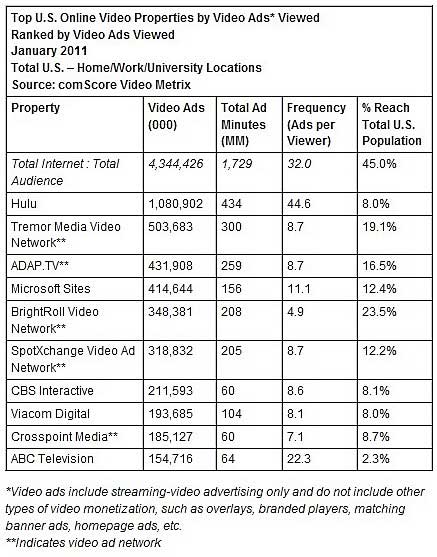
Americans viewed more than 4.3 billion video ads in January, with Hulu generating the highest number of video ad impressions at nearly 1.1 billion. Tremor Media Video Network ranked second overall—and highest among video ad networks—with 503.7 million ad views, followed by ADAP.TV (431.9 million) and Microsoft Sites (414.6 million).

The amount of time people spent watching video ads totaled 1.7 billion minutes in January, with Hulu streaming the largest duration at 434 million minutes.
Video ads reached 45% of the total US population—and average of 32 times during the month. Hulu delivered the highest frequency of video ads to its viewers with an average of 44.6.
The top video ad networks in terms of their actual reach delivered were Tremor Media with 46.8%, BrightRoll Video Network with 41.9%, and Break Media with 40.7%.


