Traffic to retail sites surged in November as Americans began their online holiday shopping, according to comScore. Motivated by free shipping, price cuts, and discounts, consumers drove high traffic volume to online coupon and incentive sites as shoppers scoured the Web for money-saving opportunities.
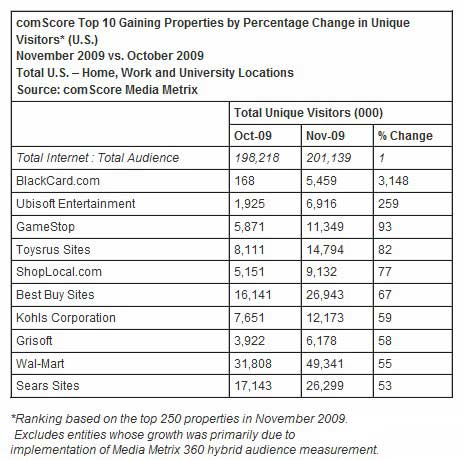
Top 10 Sites by Visitor Growth
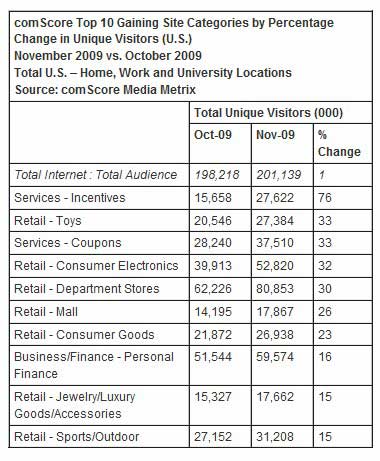
In November, traffic to each of the top retail sub-categories––Toys, Consumer Electronics, and Department Stores––increased more than 30% from October, assuring retail sites' prominence among the top 10 gaining properties.

- Toy Sites. Toy websites attracted 27.4 million Americans during the month, a 33% increase from October. Toysrus Sites led the category with more than 14.8 million visitors, an increase of 82% from October, ranking it as the fourth top-gaining property in November. The LEGO Group followed 3.8 million visitors, up 12% from October, followed by Disney Shopping with 2.6 million visitors (up 29%), and AmericanGirl.com with 1.9 million visitors (up 44%).
- Consumer Electronics. Consumer Electronics sites grew to 52.8 million visitors during the month, a 32% increase from October. BestBuy.com led the category, with nearly 25 million visitors, followed by Walmart Electronics with 9.9 million visitors, up 139% from the previous month. Radioshack Corporation ranked third with 5.1 million visitors, followed closely by eBay Electronics US with 4.8 million visitors (up 12% from October) and Buy.com with 4.4 million visitors (up 11%).
- Department Stores. Online Department Stores reached nearly 81 million unique visitors in November, an increase of 33% over the previous month. Walmart.com led the category with 46.2 million visitors (up 62% from October), followed by Target Corporation with 38.8 million (up 43%), Sears.com with more than 19 million (up 36%), JCPenney Sites with 15.4 million (up 34%), and Macy's Inc. with 12.7 million (up 38%).
Incentives & Coupons Categories Spike
Online shoppers searched for bargains this holiday season as traffic to Incentive Sites jumped 76% in November, attracting 27.6 million unique visitors and making it the top-gaining category for the month.
Coupon Sites was the third top-gaining category in November, growing 33% to 37.5 million visitors. Coupons, Inc. held the leading position with more than 8 million visitors (up 9% from October), followed by EverSave.com with 5.3 million visitors, and RetailMeNot with 5.1 million (up 43%).
BlackFriday.info underwent a massive surge in activity, increasing more than 1,000% to 5 million visitors, while GottaDeal.com surged 955% to 1.8 million visitors.

November E-Tail Driven by Black Friday and Cyber Monday
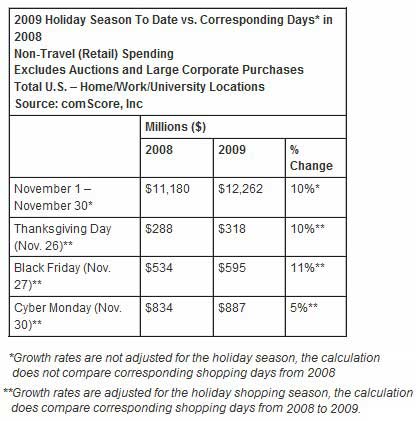
Overall online spending reached $12.3 billion in November, a 10% increase over November 2008, when—admittedly—spending was low because of the economic crisis.
Online retailers opened the holiday retail season by aggressively communicating their discounts and promotional offers well ahead of Thanksgiving. The result was that Black Friday (November 27 and the traditional kickoff day to the offline holiday shopping season) achieved $595 million in online sales, an increase of 11% compared with Black Friday 2008.
Cyber Monday (November 30 and the traditional kickoff day for the online holiday shopping season) reached $887 million in online spending, up 5% from the previous year, as Americans returned to work and turned to the Internet for holiday purchases and exclusive online offers. Notably, over 50% of all online purchases on Cyber Monday were made from work computers.

November US Core Search Rankings
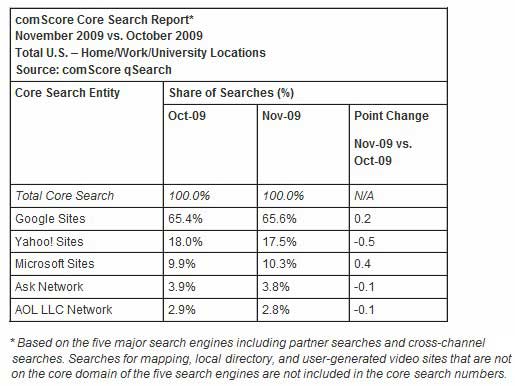
Google Sites led the US core search market in November with 65.6% of the search queries conducted, up marginally from October. Google was followed by Yahoo Sites with a 17.5% share (down 0.5 percentage points from October) and Microsoft Sites at 10.3% (up 0.4 points). Ask Network captured 3.8% of the search market, followed by AOL LLC with 2.8%.

Looking for solid, substantiated information about search engine marketing from the industry's best resources? The 84-page Search Engine Marketing Factbook featuring 55 charts provides data on who is using search engines and how, as well as data on keywords, clicks, and paid search metrics. This search-related factbook consists of chapters 1 & 3 from the larger Digital Marketing Factbook—a 144-page compilation of data and 110 charts that also covers search engine marketing and social media.


