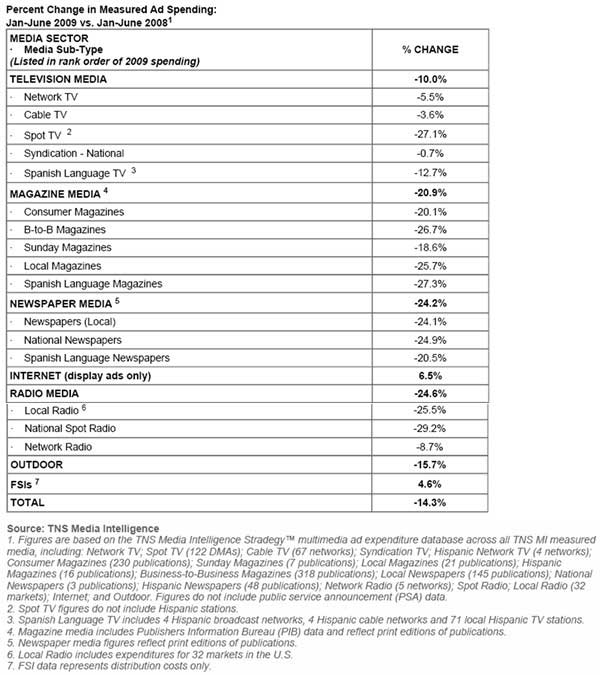
Total measured advertising expenditures in the first six months of 2009 fell 14.3% versus a year ago, to $60.87 billion, according to recently released data from TNS Media Intelligence. Ad spending during the second quarter of 2009 was off 13.9% compared with last year, the fifth consecutive quarter of year-over-year declines.
Internet display (+6.5%) and FSI’s (+4.6%) were the only media to achieve expenditure growth in the first half of 2009. Each benefited from larger budget allocations by CPG marketers. Online publishers also capitalized on a spending surge from wireless telecom operators:
Key findings:
- Print media continued to suffer large rollbacks in ad pages from key categories and this resulted in aggregate spending declines of 24.2% for newspaper media and 20.9% for magazine media.
- Total spending in radio media was down 24.6% because of ongoing weakness in automotive, retail, and local services.
- Among television media, ad spending on network TV declined 5.5% and cable TV slipped 3.6% in the first half of 2009. For both, Q2 results were slightly worse than Q1. Spot TV expenditures dropped 27.1%, buffeted by the slump in auto and retail activity.
Ad Spending by Advertiser
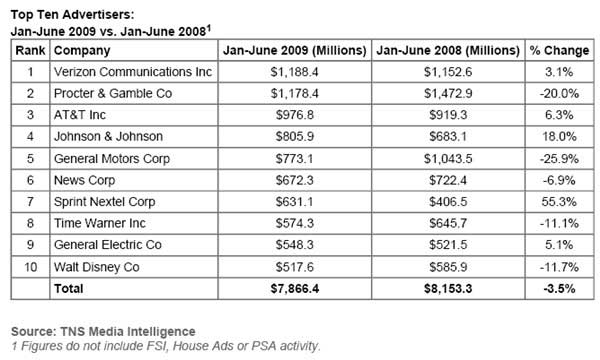
The top 10 advertisers in the first six months of 2009 spent a combined total of $7,866.4 million, a 3.5% decrease from last year. Across the top 100 companies, a more diversified group of marketers representing almost one-half of total ad expenditures, spending fell by 6.2%.
Verizon Communications edged out Procter & Gamble to claim the top spot in the rankings. The telecom behemoth spent $1,188.4 million, up 3.1% from last year. Its two leading competitors also landed in the top 10. AT&T was the third largest advertiser with total ad expenditures of $976.8 million, up 6.3% versus a year ago. Sprint Nextel, after slashing its ad budgets in 2008, reversed course and spent $631.1 million, a gain of 55.3%:
Key findings:
- Procter & Gamble slipped to second position in the rankings after reducing its half-year spending by 20%, to $1,178.4 million. The company pared its TV budgets by 30% while leaving magazine spending untouched.
- The only other packaged goods marketer in the top 10 was Johnson & Johnson, which spent $805.9 million, up 18.0%.
- General Motors had the largest budget reduction among the Top 10, with spending down 25.9% to $773.1 million; it was the only auto maker to make the list.
- Media companies rounded out the Top 10, with General Electric posting a spending increase of 5.1% while News Corp., Time Warner and Walt Disney each finished the period with decreases. At each of these advertisers, results were primarily shaped by their movie studio divisions.
Ad Spending by Category
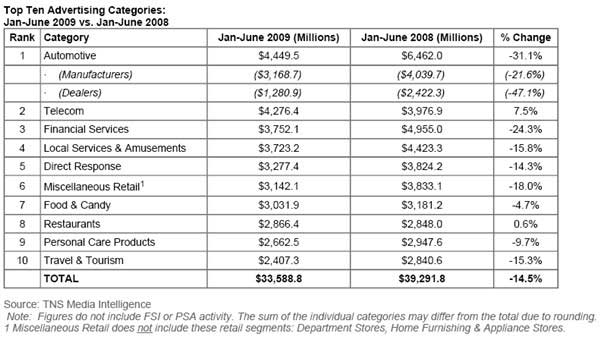
The 10 largest advertising categories in the first half of 2009 spent a total of $33,588.8 million, a drop of 14.5% from a year ago. Automotive barely held on to the top spot after expenditures plunged 31.1% to $4,449.5 million in response to depressed sales of new vehicles. Dealer spending was off more sharply than manufacturers. Through June, auto advertising is pacing at a level one-half its 2005 peak:
Key findings:
- Heightened competition among wireless phone companies and TV service providers boosted telecommunications category spending to $4,276.4 million, an increase of 7.5%.
- The only other top category to achieve a gain in the period was restaurants, up 0.6% to $2,886.4 million.
- Financial services advertising sank 24.3% to $3,752.1 million. As consumer lending seized up, credit card companies and loan providers severely curtailed their marketing programs.
- Consumer-packaged goods, a traditional pillar of strength in advertising recessions, performed better than the overall ad market but still wound up in negative territory. The food and candy category slipped 4.7% to $3,031.9 million, and personal care products declined 9.7% to $2,662.5 million.
- Further down the rankings, other CPG segments also fell: Non-Rx remedies was 5.7% lower, at $1,799.4 million, and household products was down 2.7% to $1,027.9 million.
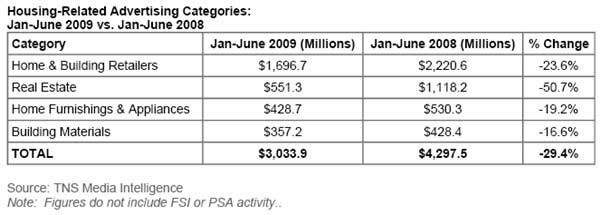
Elsewhere, the impact of the housing market slowdown was reflected in sharply lower ad spending from housing-related categories:
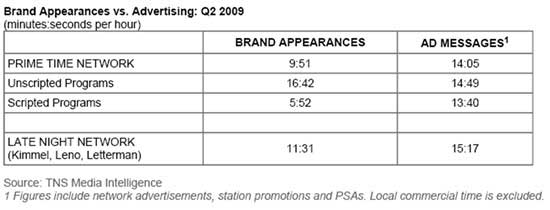
In the second quarter of 2009, an average hour of monitored prime-time network programming contained 9 minutes, 51 seconds (9:51) of in-show brand appearances, a 19% increase from a year ago. In addition, there was 14:05 per hour of network commercial messages. The combined total of 23:56 of marketing represents 40% of a prime-time hour.
Key findings:
- Unscripted reality programming had an average of 16:42 per hour of brand appearances as compared with just 5:52 per hour for scripted programs such as sitcoms and dramas.
- Late-night network talk shows averaged 11:31 per hour of brand appearances. The combined level of brand appearances and network ad messages in these shows reached 26:48 per hour, or 45% of total programming time.
- Among all monitored network programming during the period, Hell’s Kitchen had the highest average volume of brand appearance time at 58 minutes, 14 seconds (58:14) per hour.
- Rounding out the top five were Celebrity Apprentice (49:58); Biggest Loser: Couples (45:02); American Idol (42:44); and Chopping Block (33:13).
About the data: The data cited here comes from TNS Media Intelligence, part of TNS Media.


