For a piece of digital content to succeed, it needs to engage. That may sound trite, but engagement is the biggest challenge for content marketers today, and it's nearly always the deciding factor between a hit campaign and a miss that "fell just short."
And in a content landscape that increasingly values originality, one way savvy content marketers are engaging audiences (and so achieving their digital marketing goals) is the creation of compelling interactive content.
What Is Interactive Content?
It comes in many forms, but all interactive content shares one main trait: It's built to have an audience actively engage with it in a way that isn't solely reading.
Interactive content is nearly always customizable. It allows user input, and it is functional only when a user engages with it.
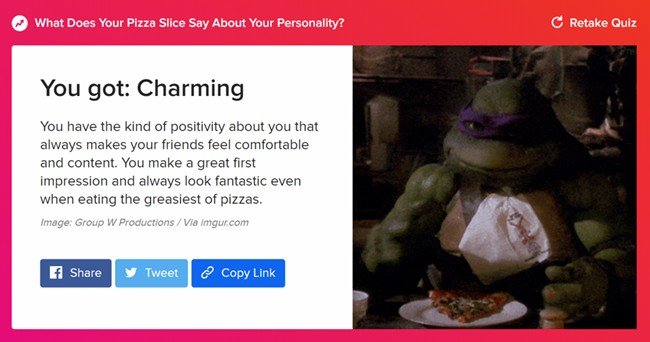
You'll recognize typical interactive content: calculators, polls, maps, and even quizzes that find out what your pizza slice says about your personality. And at least for this content marketer, that quiz was dead-on:
The Technical Truth About Interactive Content
You may be thinking, "Fine, but I don't have the technical chops to pull this off."
Rest easy. The best-kept secret in content marketing is that you can be successful at creating interactive content without knowing how to code. Sure, knowing JavaScript or some other languages may help, but there are tons of free (or near-free) tools available that will create awesome interactive content for you. I'll list some of my favorites later (I have no affiliation with any tools mentioned in this article.)
With these tools, you plug in your data or information into templates, and you'll usually receive an embeddable HTML back. If you want to do something that a tool doesn't already do and you actually do need a developer, GitHub has nearly infinite repositories of already-completed interactive projects that developers can draw from to minimize the work needed on your project.
Four Types of Interactive Content That Can Help You Achieve Your Marketing Goals
Whether you're driving social engagement, building brand awareness, driving traffic to your site, showing off a new product, or even improving your SEO through earned links and press mentions, interactive content can help you achieve your marketing goal.
In all of those cases, the same principle applies: For any marketing initiative to be successful, you need to be able to capture an audience's attention.
Here, I'll profile some of my favorite (and extremely doable) forms of interactive content, highlight some resources on how to start making your own interactive content, and give some pointers and best-practices for how you can use interactive content to achieve your marketing goals.
1. Calculators
You've likely seen calculators that can help you plan your financial future. Calculators are a great way to make your audience want to interact with your content, because they help solve a problem.
If someone is looking at your calculator, chances are they're already somewhere in the sales funnel looking for answers to particular questions. The calculations are seen as tangible, trusted, and transparent.
For instance, most lenders, banks, and affiliate sites will offer handy mortgage calculators that can estimate monthly payments. Users can punch in financial data (income, debt, etc.) and find out what the terms of standard mortgage could be for them. You can find examples of financial calculators on sites like Nerdwallet and Student Loan Hero.
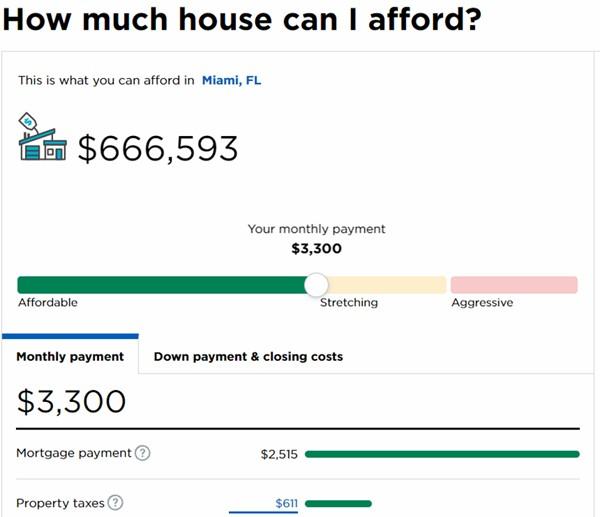
But calculators can make for compelling content in any vertical, not just finance.
How calculators help achieve marketing goals: As noted, if people are on your site and using your calculator, they're trying to solve a problem. If conversions are your goal, calculators can immediately show a user the value of your product, often in numbers (read: dollars). Calculators also help you build trust with a potential client, because they're transparent and tangible.
Where to start: I've seen successful calculators built solely in Google Sheets. Though a formal version may need some JavaScript knowledge, tools like jscalc.io offer customizable and embeddable calculators for nondevelopers.
2. Dynamic Tables and Graphs
Dynamic tables and graphs let users sort, filter, and otherwise modify data to view it in the way they find most interesting. By being able to sort columns in a table, users are able to take a bunch of information and zoom in on the parts they really care about.
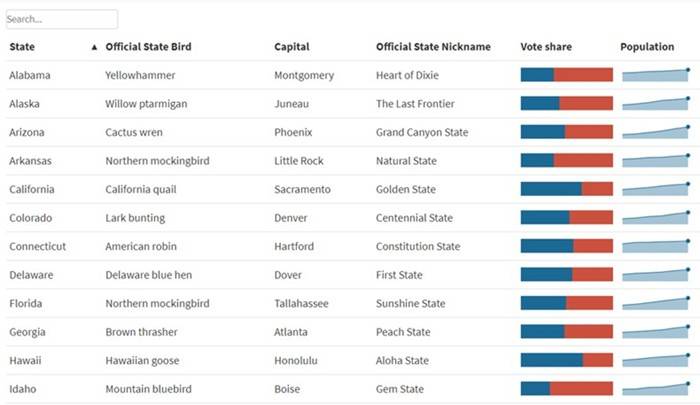
Dynamic graphs (especially Treemaps) are similar and let you drill into subsections or pieces of data. They can also be something as simple as a tool tip on an existing chart that lets users explore different data points.
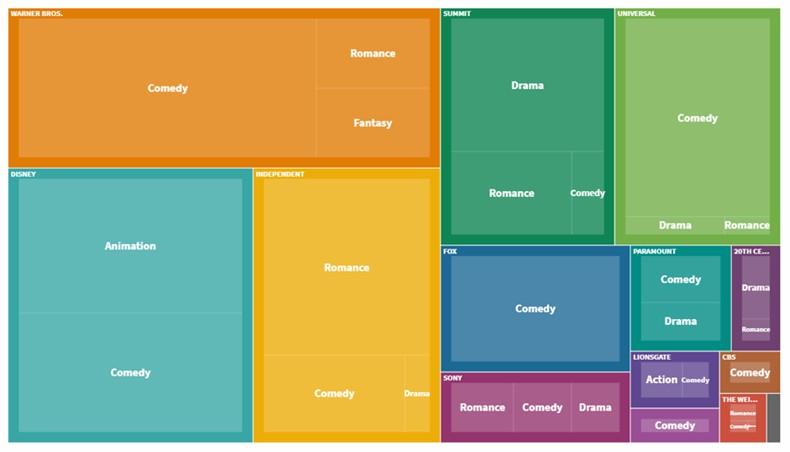
How dynamic tables and graphs help achieve marketing goals: Often, it's hard to tell a story with a lot of data in a way that will appeal to users. By allowing users to customize what data they're seeing, they're able to best apply it to themselves. These are great tools for link-building, as publishers in different verticals might care about different portions of your data. If your data also highlights your product (for instance, if you made a table comparing product features vs. competitors'), users can easily customize and pick the features they want to focus on, allowing you to better show off the value in your product.
Where to start: My favorite tool for pretty much any data visualization these days is flourish.studio. The interface allows you to input pivoted (and often raw) data and select from a huge list of potential visualization styles, all of which are entirely customizable. It also includes seamless animation and it's great with adapting to mobile.
3. Quizzes
In some pieces of content, quizzes can bridge the gap between the story you're trying to tell and the reader. A lot of great pieces exist about how much or little people know about topics, but what the reader really wants is ego fuel: How much do they know compared with everyone else?
Embedding quizzes into your content drives that ego-bait and promotes shareability if they like their result and want to show it off!
Great content not only identifies how many people recognize the Kit Kat jingle but also gives you the chance to see how well you stack up against the competition.
How quizzes help achieve marketing goals: Quizzes lend thesmselves especially well to social media goals, because there is something inherently competitive about them. Most interactive quizzes already have a "share on social" button within them, and you can show off your results to see how you compare against friends. And because people have their own interests and areas of self-proclaimed "expertise," if a quiz relates to their particular niche, friends or family will know to tag them in it.
Where to start: There are a lot of great online tools you can use to build your own quiz. I've had success using trynteract.com, which allows for customization, embedding, and social sharing in an easy-to-use quiz building platform.
4. Maps
If someone gave you a map of the places with the highest crime rate, nine times out of ten you'll look for where you live. Maps offer ego bait, or more specifically what content creators refer to as geo bait, because audiences always want to see what their area is like and how it compares with other places.
This is true of any map, but interactive maps have a distinct advantage over static maps in that you can cram a lot more information in them. Think of a static map: You can essentially include only one figure and maybe a color scale. With an interactive map featuring tooltips, you can include as much information you want. Interactive maps also let you change data sets, look at different years of data, or provide other customizable information without using any more desktop space and without creating multiple graphics.
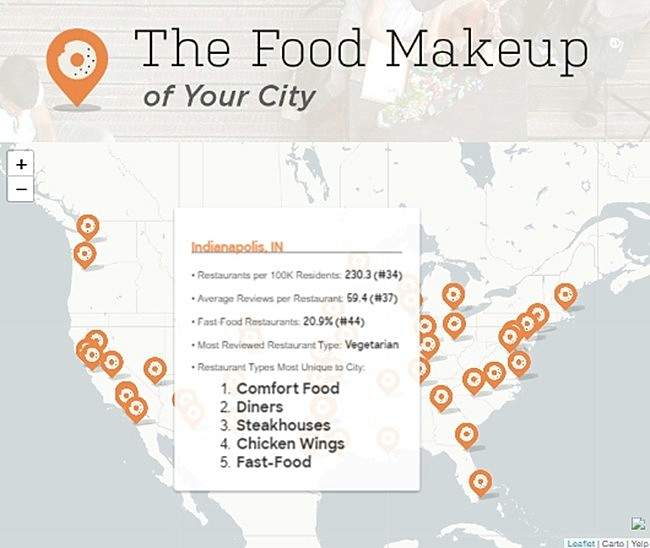
How interactive maps help achieve marketing goals: Interactive maps can be extremely effective at earning mentions and building backlink portfolios because of their ability to be hyperlocal. There are publications in nearly every city in the US that need things to write about, and by offering interactive maps that let people focus on specific areas, you're giving them the ability to find highly customized data without having to manually provide data to each individual publisher you're pitching.
Where to start: Tableau Public offers free, fully customizable, embeddable dashboards that you can easily make interactive maps with. I use this tool a lot, because it has a huge amount of data built in and already knows things like metro areas, states, cities, and even the streets and highways, so I never have to interact with messy shapefiles.
If you or your developers know JavaScript, d3js.org is an incredible building block for customizable maps.
Making Interactive Content Work for You
Although those four examples of interactive content were specific, they showcase only a small range of interactive possibilities. From a simple flipbook on a news site to more advanced games that tell you a story, interactive content is a powerful tool.
Its possibilities are as endless as your imagination. With some basic tools and simple Google searches, content creators—even the less technically inclined—can create brilliant content that can help them achieve their marketing goals.


